Bullish Reversal Patterns - One of the most significant goals of technical analysis is to identify changes in direction of price action. Because candlesticks give visual insight into what the market is market psychology, one of the most useful aspects of candlestick analysis is its ability to suggest changes in the sentiment of the market, and reversals in trend. We call these candle formations Reversal Patterns.
Important to note is that with candlesticks a reversal pattern does not necessarily suggest a complete reversal in trend, but merely a change or pause in direction. That could mean anything from a slowdown in trend, sideways trading after an established trend, or a full turnaround following a reversal candle pattern.
Abandoned Baby
• Day-one is a red day continuing an established bear trend.
• Day-two is a doji whose shadows trades below day-ones close.
• Day-three is a blue day that opens and trades above with little or no overlapping shadows
The Abandoned Baby is a rare bullish reversal pattern characterized by a large down move followed by a doji or small candle, and then a third candle heading in the opposite direction. The formation reflects a classic three period reversal of market sentiment where after a bearish trend, finally enough buyers enter the market to take control. They first stop the trend's momentum (forming the doji), and then ultimately reverse the direction of the market. This first red candle suggests a continuation of the bear market. That move is followed by a doji, where markets trade in a small range suggesting uncertainty in trend and a rally potential. Up to day two we actually have a Bullish Doji Star, moderate strength bullish pattern. After the day of indecision, a large bullish candle confirms buyers are staging a rally and reversal. The stronger the move up day-three, the stronger the reversal signal. Watch for additional bullish price action in the next few days.
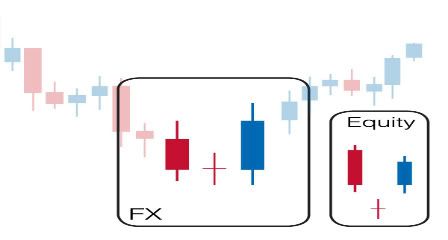
In Foreign Exchange this pattern is near identical to the Bullish Morning Star Doji pattern. Outside of the FX Market Abandoned Babies require gaps between the close and open prices of subsequent candles and shadows. In fact the name Abandoned Baby suggests the doji baby candle is disconnected from the rest of the formation. This is possible because gaping is common in other less efficient markets where trading is restrained by exchange hours. Since the currency market offers 24 hour trading, gaping is rare and is only seen to a minor degree after weekends.
 Three Outside UP
• After an established downtrend, day-one continues the trend with a red candle • Day-two is a long blue day that engulfs the body of the first day, closing well above the previous days open. •
The third day is a blue day with an even higher close than the second day.The Bullish Three Outside Up pattern is one of the more clear-cut three day bullish reversal patterns. The formation reflects buyers overtaking selling strength, and often precedes a continued rally in price. In fact up to day-two we have a bullish Engulfing Pattern, itself a strong two-day reversal pattern.
 Three Inside UP• After an established downtrend, day-one is long red day
 • Day-two is a blue day that trades up to the midpoint of day-one
• The third day is a blue day carrying price above the first bearish candle.
Up to day-two we have a simple Bullish Harami pattern. Haramis give a clear-cut formation reflecting buyers overtaking the strength in the downtrend. This formation often precedes a continued rally in price. With just a Harami pattern, Candlestick analysts will usually wait for additional conformation before entering a long position. The Bullish Three Inside Three formation offers that confirmation. Additional Confirmation For this candle to take full strength day-threes candle needs to close above day-ones high, creating a new high. The Bullish Three Inside Up formation suggest buyers have seized a degree of control from the bear trend and analysts will watch for buying opportunities to come.
 Morning Doji Star
• After an established down trending day-one is a long red day
• Day-two is a doji where the open and close are equal.
• Day-three is a blue day
Bullish Morning Doji Stars are a rare reversal pattern that offers one of the strongest bullish reversal signals in the Forex Market. Morning Star formations are characterized by a continuation of a bearish trend followed by a Doji, reflecting uncertainty in the strength of trend. Up to day two we actually have a Doji Star formation, a moderate strength bullish pattern. After the day of indecision, the trend reversal is confirmed when a rally creates the large bullish candle. The stronger the move up on day-three, the stronger the reversal signal. Watch for additional bullish price action in the next few days. In FX this formation practically identical to the bullish Abandoned baby. In non-FX markets candlestick analysts traditionally look for gaps to signal the strength of the Morning Doji Star pattern. Gaps between the close price and open price are very common outside efficient FX markets, since exchanges are traditionally limited to very short trading periods. Because Foreign Exchange trades 24 hours, gaps are very uncommon and need to be ignored in identifying Morning Star patterns.
 Three White Soldiers
• After a downtrend, three consecutive long blue days occur
• Each day closes higher than the previous day
Following a downtrend, three long blue days with consecutively higher closes act as a strong indicator, certainly the very definition of an uptrend, and almost assuring bullish moves to come. The patterns stresses caution for those looking to short a particular currency pair. Candlestick traders will watch for more bullish or ranging markets in the future, but if the candles are too overextended analysts will worry that the market may now be overbought and pause accordingly.
AKA: Before multicolour monitors, many charting packages used white candles to designate uptrend candle bodies, hence the name Three White Soldiers.
 Moderate Reliability Bullish Reversal Patterns
Breakaway
• The first day is a long red day continuing an established down trend.
• The second, third and forth days all continue in the same direction with lower closes, but more weakly than the first bearish push.
• The fifth day is a long blue day that closes into the body of the first or second days.
The first few candles suggest the strength of the trend has accelerated significantly. By the third and forth days, weaker moves down suggest the move has started to slow. In fact the first three to four days matches the bullish Three Stars in the South formation. The Three Stars in the South Pattern is not normally a strong reversal pattern and traders usually wait for additional confirmation the next day. The last candle of the Bullish Breakaway offers exactly that confirmation. After the few days of deteriorating bearish trend, a clear bullish candle emerges to reorient the market's direction. Markets typically want to see the bullish candle that moves at least above the previous two or three day's body for ideal confirmation. Number of Middle Candles Ideally we'd see four red candles before the large bullish move, but realistically there could be two, three or even five candles that communicate the same information of weakening bearish trend. Thus traders look for four candles when identifying this formation, but similar formations will be accepted. Candlestick analysts in non-FX markets typically require Breakaways to have gaps after the first big bearish move on day-one. Variations in gaps suggest changing strength of Breakaways. Due to the nature of the more efficient 24 hour currency market, traders will not see such gaps.
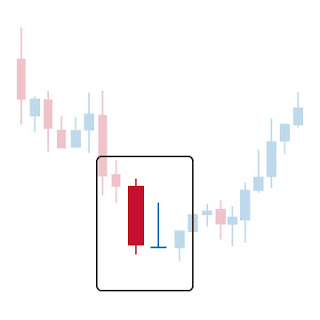
 Doji Star
• The first day is long red day
• Second day is a doji that opens at the previous day close
• The doji wicks should not be long
The Doji Star formation starts as the bear market continues with a strong red day. The second day however trades within a small range and closes at or near its open. This small range suggests uncertainty in the market, and in fact candlestick analysts consider the smaller the doji the better for strength of signal. This is taken as a sign that sellers are losing control, bearish momentum is weakening and buyers are regaining control. For strong confirmation of trend reversal, watch for a blue day with a higher close on the third trading day. Such a formation on the third day would be the strong Bullish Abandoned Baby or Morning Star Doji. In non-FX markets that do not track price 24 hours, traders watching for added signals of strength in this formation would look for a gap to take place on the second day, as the Doji Star open below the previous days close. Such a gap of course is not possible in the Forex Market, unrestrained by artificial exchange hours.
 DragonFly Doji
• Pattern is strongest after an established bearish trend • A candle forms with a very small to almost nonexistent body with a long lower wick
• The lower wick is at least twice as long as the candlestick body
• Little or no upper wick
In a bearish trending market the dragonfly illustrates an unsustainable sell-off, where price drives up to new lows, but buyers take control of the trend by market close. Although this formation is a moderate to weak signal, it is a warning for longs that the downtrend is losing momentum and bull may retake the market soon. Most candlestick analysts will wait to confirm the signal, watching for a blue candle on day two. • Dragonfly vs. Hanging ManThe Bullish Dragonfly Doji Pattern is a rare single candlestick pattern that occurs at the bottom of downtrend. It is very similar to the Bullish Hammer Pattern, except on a Dragonfly Doji the opening and closing prices are nearly identical (no body). The Bullish Dragonfly Doji is more reliable than a Bullish Hammer and it tends to be a stronger bullish signal. In non-FX markets traders accept a gap between day one and day two. Since such gaps are unlikely in the 24 hour Forex Market, when this pattern is translated into FX, the Dragonfly could also appear like a Hanging Man, and would still be the same moderate strength. Regarding strength of signal, the more the dragon fly looks like a Doji, the more it reflects buyers taking control of the sell-off, and the strong the bullish reversal signal.
 Engulfing• After an established downtrend, day-one continues the trend with a red candle
 • Day-two is a long blue day that engulfs the body of the first day, closing well above the previous days open.
The Bullish Engulfing is one of the more clear-cut two day bullish reversal patterns. The formation reflects buyers overtaking selling strength, and often precedes a continued rally in price.
• Day-One: Characteristics for Signal StrengthThe first day may even appear as a Doji, and the smaller day-one is and larger the second day is, the stronger the reversal signal. Dojis and small candles reflect uncertainty in the markets trend, thus the smaller the first days candle the better the signal of an end to the established bear trend.
• Day-Two: Characteristics for Signal StrengthThe second day bull move acts to confirm the death to the bear trend. The bigger the blue candle reflects the stronger the rally and the better the reversal signal.
• Overall Characteristics for Signal StrengthThis pattern is also more meaningful if it follows a lengthy downtrend, or a recent fast move down. Both these cases suggest the market may be oversold and more apt for a reversal. • Support Level CreatedBullish Engulfing patterns also provide resistance levels for where the lowest level of price action reached. In the future this level tends to offer good support.
 Hammer
• After an established downtrend • Hammer candles have a small real body that forms at the upper end of the days trading range
• The candle can be either blue or red, analyst usually do not differentiate.
• Lower wick at least twice as long as the real body
• No (or almost no) upper wick
After a bearish sell-off a significant rally brings price back up creating a long bottom wick. By day end buyers are able to push prices back to the upper range creating a short body. The Hammer pattern signifies a weakening in bearish sentiment. The long lower wick signifies an initial continuation of the downtrend. However, renewed buying sentiment acts as support and drives the price higher to close near its opening price.
• Strength and ConfirmationThe strength of a Hammer formation depends on where it appears. If a hammer forms near support levels, then the likelihood of a strong bullish reversal is high. However, if the hammer forms in the middle of a trading range it tends to have little significance. In ideal conditions traders want the wick length to be several times longer than the body of the candle. The longer the candle, the more buyers were able to drive price back up and the stronger the bullish signal this candle provides. Although above we state that most analysts do not care if the small candle is red or blue, traders will actually take a blue candle to suggest a stronger bullish signal. Buyers being unable to bring the close price above the open price suggest additional bullish strength. Generally the difference between blue and red candles is minimal. The bullish Dragonfly Doji serves as a stronger buy signal than the Hanging Man pattern. Since a Dragonfly candle (where open and close are identical, but we see a low similar in length to the Hanging Man) reflects more uncertainly and lack of direction, candlestick analysts will usually take it as a stronger buy signal.
• Hammer vs Hanging Man.Alone, Hammer and Hanging Man candles look identical. Their difference lies in what type of trend the candle follows. If the market had been trending up for a while the formation is a Hanging Man. In fact the name, Hanging Man, suggest price is hanging over a precipice, ready for a fall. Hammers follow a bearish trending market and its name suggest price has already been weighted down. Although traders will usually wait for confirmation the next day, look for buying opportunities to come.
 Ladder Bottom
• After an established downtrend, three red days with consecutively lower closes occur • The fourth day is a red day with an upper wick. An Inverted Hammer
• The fifth day is a blue day
The first several days establish a consistent downtrend. As time progresses however shorts take the opportunity to par-off their positions and take profit. This is illustrated in the fourth days red Inverted Hammer candle. As prices are bid up, the high is pushed up. But in this formation sellers are still able to drive price down to levels nearer the open creating a small body. Up to day-four in the formation this just suggests that sellers are losing firm control of the market. By the fifth day, a bullish rally creates the long blue candle. Candlestick analysts would look for buy entry opportunities to come.
 Morning Star
• After an established downtrend, day-one is a long red day • Day-two is a short candle or Star candle.
• Day-three is a blue candle
Morning Stars start with a continuation of the bearish move. The second day sees a continuation of the move down, but a rally makes the market close at or near the open for the day. The first two candles weakly suggest a loss of bearish momentum. In fact up to day two this formation looks close to the Bullish Hammer moderate strength reversal pattern. Although the example above appears red, day-two star candles can really be any color. The Bullish Hammer alone is decent signals for a rally on day-three. But since the certainty for a Hammer indicator is low, the trend reversal should be confirmed by a blue candlestick the next day. The higher price is able to move up on day-three, the stronger the reversal signal. With this pattern watch for rallies the following days. In non-FX markets gaps are quite common, and Morning Stars traditionally require a gap between the first and second day. In fact the wider the gap up from day two to three the better the signal in non-FX markets. Since FX offer 24 hour trading, no gaps should be expected. The Forex Market version of this formation would share the same market close price on day one, and then start day twos sell-off from there. Day twos close would be the same whether in FX or any other market restricted to fixed exchange hours, forming a candle similar to the Hammer. Thus this formation might more aptly be called Evening Hammer Star when applied to the Foreign Exchange Market.
 Piercing Line
• After an established trend, day-one is a long red day
• The second day is a blue candle that closes above the midpoint of the first days body.
The market continues the downtrend on the first day. By day-two buyers take price up to close near the open of the previous day. In FX, traders view the lower the second day low the better, since the bigger the sell-off after the open the more buyers were able to drive price back up.
• Confirmation and Signal Strength
This formation suggests bulls have begun to take charge of the market, and shorts have been shaken by the sudden lost of bearish momentum. Rallying days are common after this formation as more buyers confidently to enter the market with a clear stop benchmark at the second day low. The higher day-two closes into the first day candlestick body, the higher the chance of the downtrend bottoming out. If the second day candle does not trade above the midpoint of the first day body, traders typically feel it safer to wait for confirmation on the third day. Some traders wait for confirmation regardless of how deep the bullish Piercing Line penetrates the second day. In non-FX markets, traders want to see the second day gap down, opening below the close of the previous day. Because the Forex Market offers continues 24 hour markets, such gaps are not typically possible. But FX traders will turn to the low of the second day to indicate how strong the opening sell-off is, to gauge the strength of the subsequent bull move. The Piercing Line is the opposite of the Dark Cloud Cover.
 Three Stars In The South
• After an established downtrend, day-one is a long red day with a long lower wick • Day-two is also a red day similar to the first, only with a smaller body and shorter bottom wick
• Day-three trades within the second days range and has a small red body with no wick at all (Red Marubozu)
The Bullish Three Stars in the South formation suggests weakening in the established downtrend. Although each new day is able to close lower, and despite the fact that sellers are able to drive price down illustrated by the lower wicks, those short positions are not able to get the close price to continue the strong bearish trend. While the pattern predicts a reversal, it may only reflect shorts paring off their position (just a delay or respite in the downtrend). Thus analysts do not usually take the Bullish Three Stars in the South as a strong enough buy signal in itself. Instead analysts use it as an indication to liquidate short positions and watch for buying opportunities. This formation is most significant after a protracted sell-off. In non-FX Markets the Bullish Three Stars in the South require price gaps up each day. When translating this same move in price action to the Foreign Exchange Market, candles will share the same close price. Since the gap up occurs during off-exchange hours the FX version may see an upper wick.
 Tri Star
• After an established downtrend • There dojis (open and close at identical price) occur on consecutive trading daysIn a long bearish market the strength of trend shows weakness as candle bodies grow progressively smaller, eventually forming three consecutive dojis. A doji candle reveals market indecision, since neither buyers nor sellers prove able to move the close price away from the open. This kind of price action is quite common during periods with limited market activity like holidays. But after a protracted downtrend or during periods of high trading volume a number of dojis can suggest a reversal in market trend. Candlestick analysts will watch for buying opportunities to come after the Bullish Tri Star pattern. The non-FX version of Bullish Tri-Stars often sees a number of gaps between dojis. This suggests price moved while exchanges were closed. Of course such gaps between open and close prices are unlikely in more efficient, 24 hour Foreign Exchange Markets. This formation would thus appear as three dojis in a row. Realistically translating the same price-action from non-FX to Forex Markets would allow some leeway in the appearance of the three dojis, possibly morphing them into star candles with limited ranges.Belt Hold
• In a downtrend, a long red candle occurs
• The Blue candle has an open price that is very close to the low of the day
• Little or no lower wick on the candle.
After a stretch of bearish candlesticks, a strong bullish candle forms. The bullish candle opens at the day's low, and closes significantly lower. The result is a long blue candlestick with a short lower wick or no wick at all. This decided turn in direction may signify a bullish trend to come. But many traders will look for additional confirmation in the form of bullish moves the following days. The formation occurs frequently and is often incorrect in predicting future trend. To a degree the significance of the formation is fairly obvious; an downtrend is broken by a strong day's move. Thus the larger the blue candle, the stronger the likelihood of reversal. Traders will typically wait for further confirmation.
The non-FX market formation requires a large gap not possible in more efficient Foreign Exchange markets. Thus many argue that Bearish Belt Holds are simply not possible in FX, and the watered down Foreign Exchange version above should be overlooked for other more significant indicators.
 Gravestone Doji
• The first day is a red day confirming a bearish trend, closing at the lower trading range near the days low • The second day is gravestone doji day, one that has the identical opening and closing price, but the upper wick should be well into the previous days body.
• The lower wick of the second day should be non-existent or very little.
In a down trending market, buyers rally price briefly, but are not able to get the market to close above the days open. This forms the classic Gravestone Doji, named for its apparent similarity to the traditional gravestone. Although this formation is weak in signal strength, the rally illustrated by the Gravestone Doji higher wick is a warning for shorts that the downtrend is losing momentum and bears may retake the market soon.
• Gravestone Doji Market PsychologyAny Doji candle by definition has the close at or near the close price. Gravestone Dojis have a high wick reflecting a rally during the days trading. Candlestick traders will watch the following day to see if buyers are able to take control of the market trend. When day-threes price holds above the Greavestone Doji, it suggests that short positions may cover their exposure, closing out their sell positions and leading to the weakening of the bear market. Many bottom pickers will start buying once that occurs, leading to a bullish reversal. Confirmation for the Gravestone Doji pattern is strongly suggested for this pattern.
• Gravestone Doji vs Inverted Hammer Formation - An Inverted Hammer pattern is similar to the Gravestone Doji pattern, except its second day is characterized by a small body rather than a clear doji. The Gravestone Doji is a more reliable than Inverted Hammer.
 Inverted Hammer• Day-one is a red day, continuing an established trend and closing at the lower trading range near the days low
 • The second day is red or blue day that also trades at a lower range with the opening and closing near each other.
• The upper wick of the second day should be at least twice as long as the body
• The lower wick of the second day should be non-existent or very little.
The Inverted Hammer appears in a market that opens at or near its low, creating a candle with a small real body. During the day buyers rallied price fairly high, but were unable to sustain the rally.
• Psychology and Confirmation Signals for Bullish Inverted Hammer - In a market characterized by downtrend, bulls are able to rally price up briefly, but not enough to close above the days open. This can be a warning for shorts to anticipate a further, more sustainable bullish rally. The reversal trend is confirmed by bullish moves the next day. In day-three the higher the candle holds above day-twos body, the more likely the shorts will cover their positions, hence leading to the weakening of a bearish market. Many bottom pickers will start longing the market once that occurs, leading to a bullish reversal. Confirmation for the Inverted Hammer pattern is strongly suggested for this pattern. The strong bullish Gravestone Doji pattern is similar to the Inverted Hammer pattern, except Gravestone Dojis second day is characterized by a clear doji where open and close prices equal each other, rather than a small body.
 Tweezers Bottom
• In an established downtrend, day-one is a red candle with a shaven bottom. • The second day is a blue hammer or doji with a long upper lower shadow.
The essential element of this pattern a series of candles that all share the same low. This could be the two days in the examples above, or a number of days that are not consecutive. After a protracted bearish move, this may provide a weak reversal signal, but most traders will look for additional confirmation of a reversal. More useful is how this pattern creates an important resistance level. In any market, trending or ranging, this pattern establishes a support level by sharing the same low prices. Support Levels are simply price ranges that markets have trouble breaking below. Thus the low price these candles all share creates a clear benchmark for the market.


 There are 4 primary market conditions in a potential trade:


 Rules: Trade Long when Green line > 50.

 Rules: Trade Long when Green > Red
 Rules: Market Base Line (MBL) is the Overall Trend


 Volatility Bands compared to Intraday Price Action
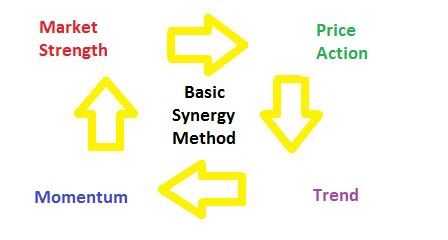
 SYNERGY Method


